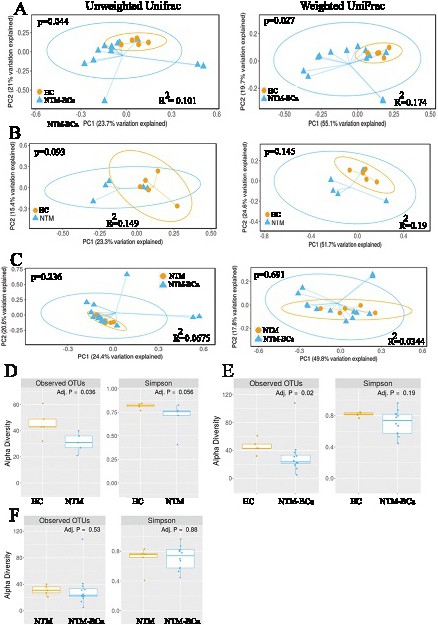
Fig. 4. Beta and alpha diversity ordination plots. (A-C) Measurement and comparison of beta diversity in various groups using both unweighted and weighted UniFrac (phylogenetic) distance matrices. Data were plotted using PCoA ordination method utilizing the OTUs as the basic units. The percentage of variability of each principal coordinates (PC) has been explained on the axis of each plot. Each colored circle or triangle represents a sample from a group, as indicated. The probability distribution has been represented by the ellipses. (D-F) Measurement of the intra-sample variation by alpha diversity analysis. The alpha diversity metrics use the counts (richness) and distribution (evenness, Simpson Index) of the OTUs within a sample as the basic values for these calculations. HC: Healthy controls; NTM: Women with NTM lung disease only; NTM-BCa: Women with both NTM lung disease and breast cancer.